Back to case studies
Data · Trading Dashboard
QuantMaven
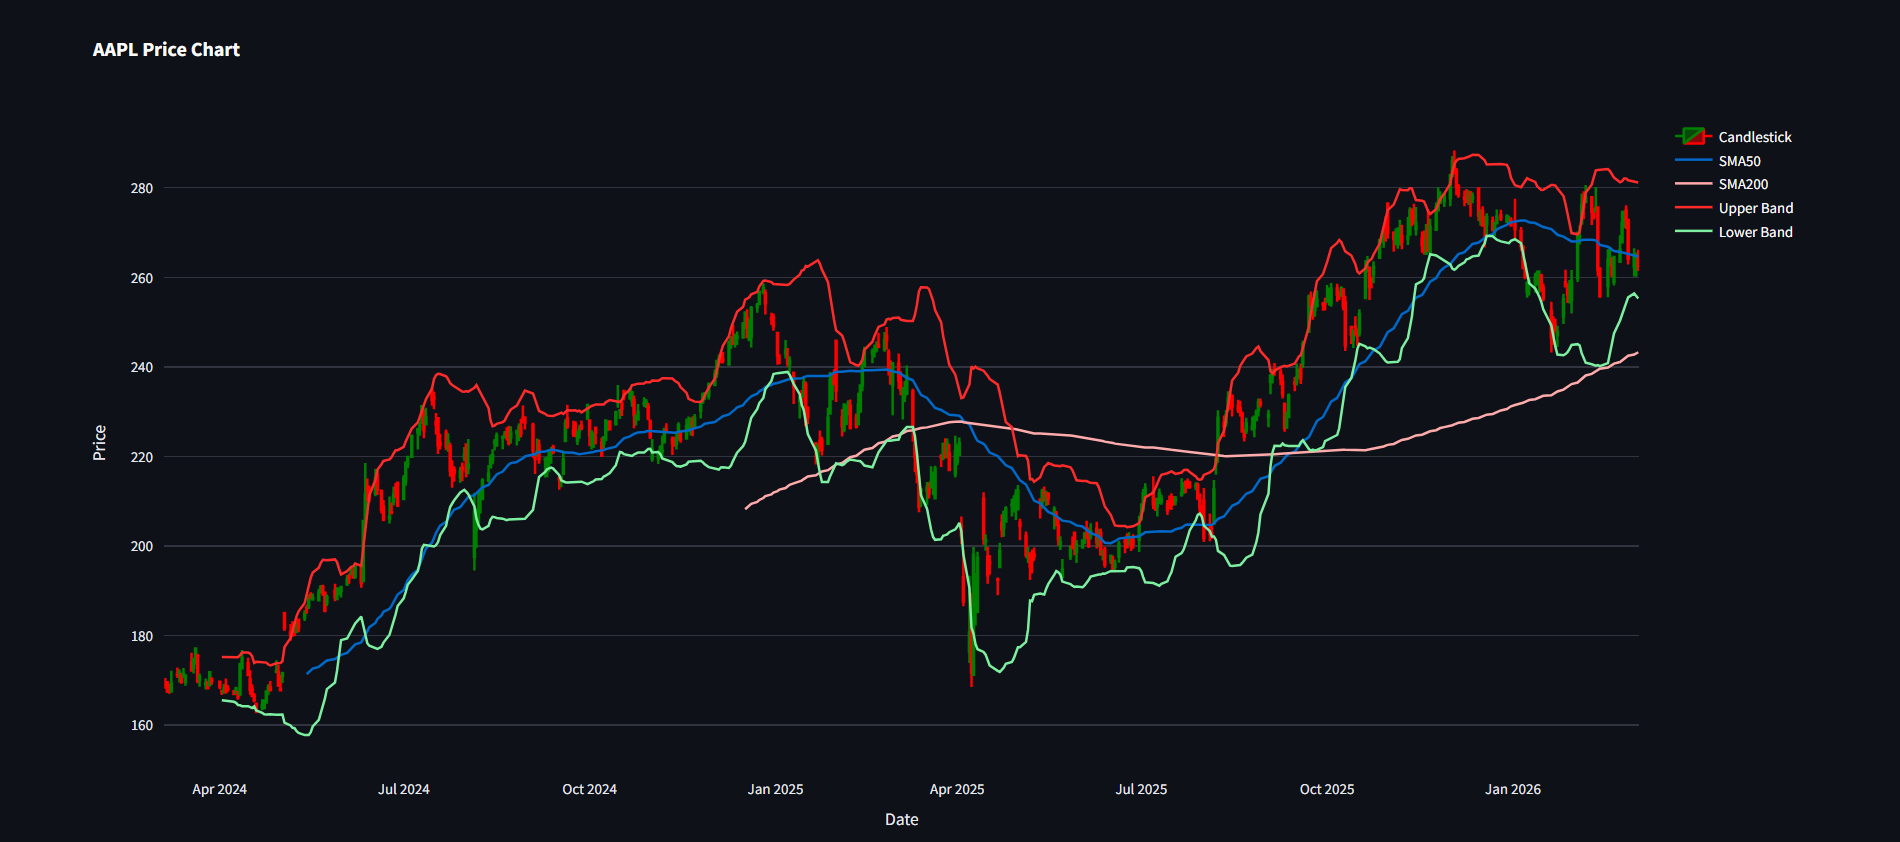
Streamlit trading dashboard with real-time stock data, RSI / Bollinger / MACD indicators, and dynamic-programming max-profit optimization across a 10-year window.

Problem
Hobbyist analysts juggle five tabs to combine indicators with backtesting. QuantMaven puts both in one shell.
Approach
- Pulled prices via yfinance with a Redis-style memoization layer.
- Implemented RSI, Bollinger Bands, MACD as pure NumPy functions.
- Solved best time-to-buy/sell via dynamic programming for k transactions over a 10-year horizon.
Results
Indicators
6
Window
10 years
Tickers
unlimited